
KRE Regional Bank Recovery
A defined-risk investment case study on regional banks, sentiment recovery, options structure, and trade management.
Vehicle
SPDR S&P Regional Banking ETF (KRE)
Sector
U.S. regional banks
Thesis
12–18 month recovery / re-rating
Structure
Bull call vertical spread
Expiration studied
January 15, 2027
Research focus
Price sensitivity, Greeks, IV, theta, payoff, risk management
Defined-risk exposure to regional bank recovery
The KRE research studied whether the market remained too pessimistic on the regional banking sector following the 2023 crisis. A bull call vertical spread was used to express a 12–18 month recovery view with clearly defined maximum loss. This page documents the full research process: thesis, structure, payoff, Greeks, and risk management.
Position Summary
Vehicle
KRE — SPDR S&P Regional Banking ETF
Structure
Bull call vertical spread
Expiration
January 15, 2027
ThinkorSwim Analysis
Trade Analysis Figures
These screenshots document the ThinkorSwim sensitivity analysis used for the KRE position. The figures show the original trade setup, base-case payoff profile, time decay, and implied volatility sensitivity. Together, they explain why the trade was structured as a defined-risk bull call vertical rather than a simple long call or equity position.
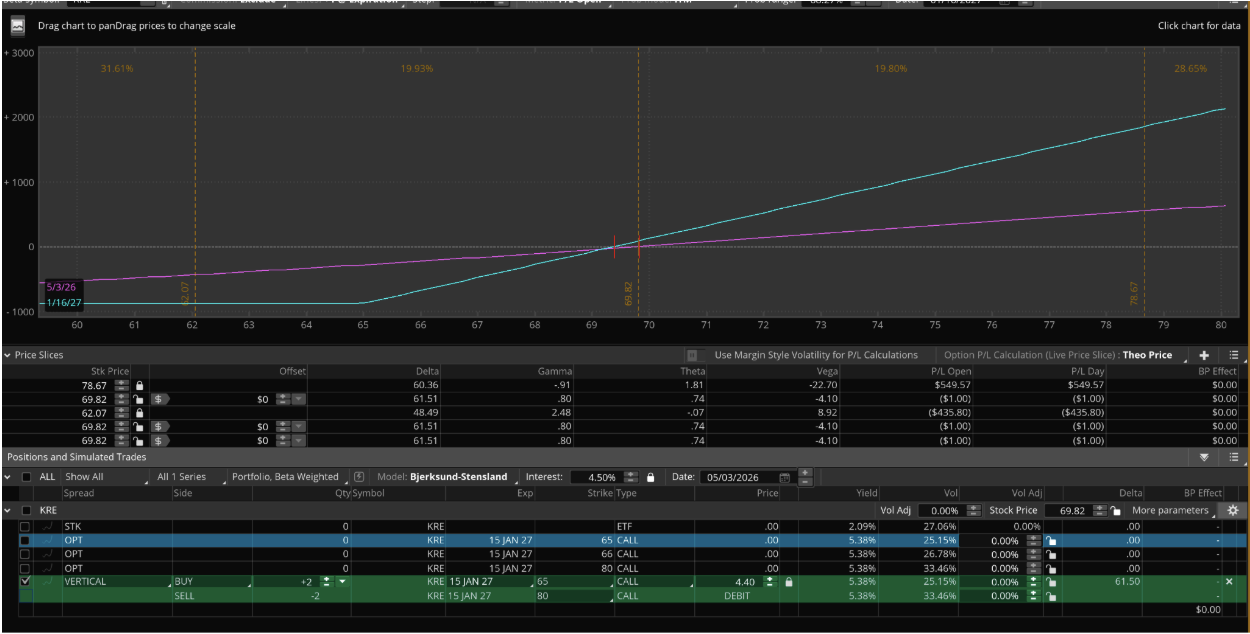
Figure 1 — Original Payoff and Position Setup
This figure shows the original KRE bull call vertical spread structure using the January 2027 65/80 call strikes. It displays the payoff curve, position Greeks, and the initial trade setup used to express a defined-risk recovery view on regional banks.
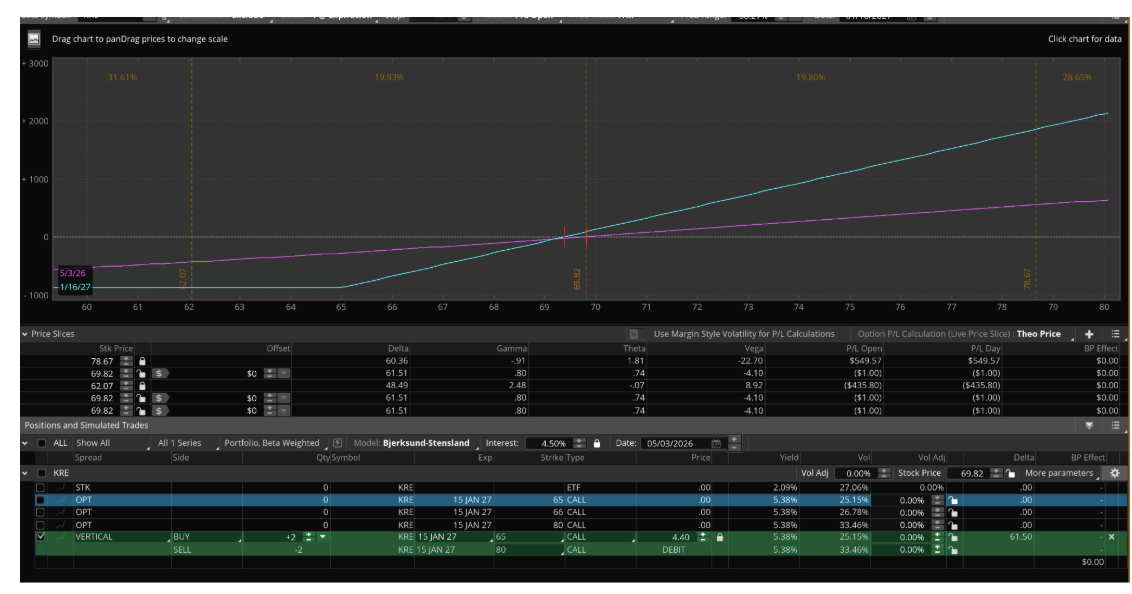
Figure 2 — Base Case Price Sensitivity
This figure shows how the position responds around the current KRE price level. The payoff profile shows limited downside below the lower strike and increasing upside as KRE moves toward the short call strike.
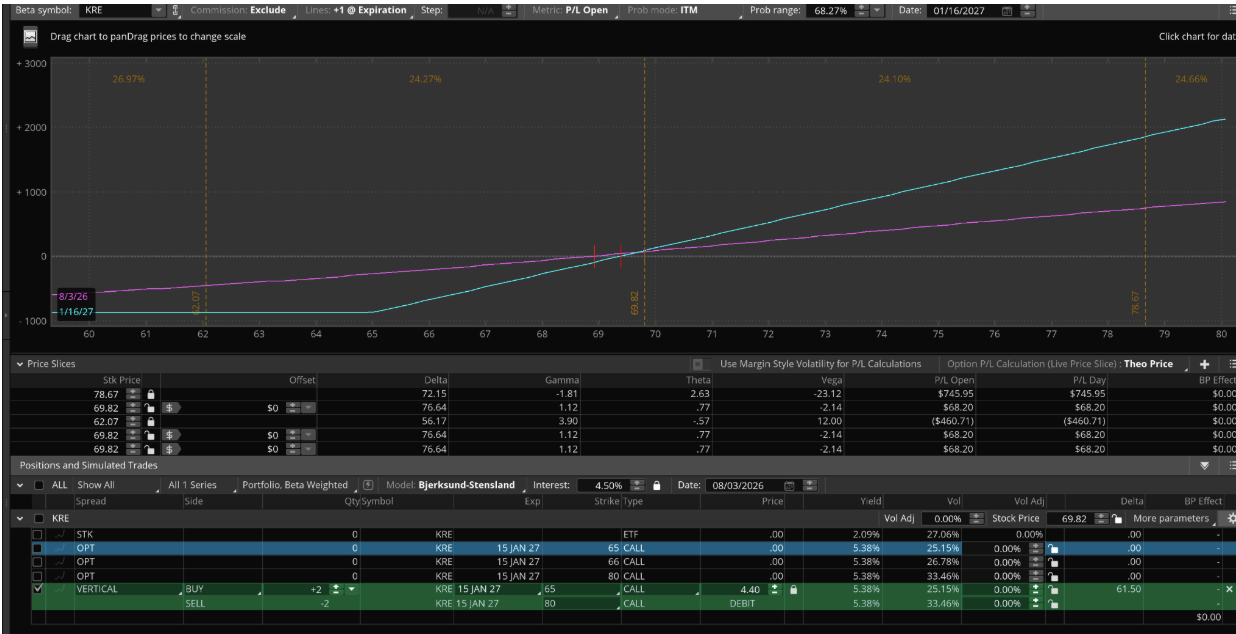
Figure 3 — Time Decay Sensitivity
This figure shows the position after time has passed while keeping the same core structure. It helps explain how theta and time decay affect the spread before expiration.
Figure 4 — Implied Volatility Increase
This figure shows the effect of a +5% implied volatility adjustment. It helps evaluate how the spread reacts if option volatility rises, which is important because banking-sector uncertainty can affect option pricing.
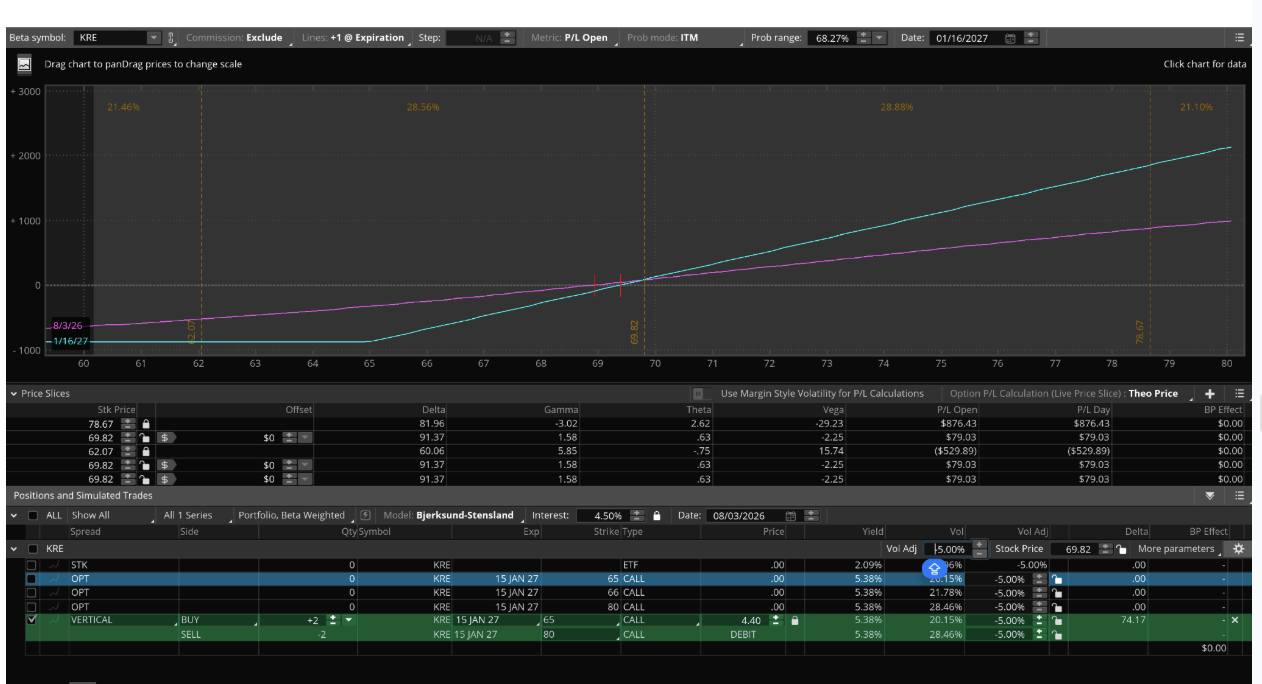
Figure 5 — Implied Volatility Decrease
This figure shows the effect of a -5% implied volatility adjustment. It helps evaluate how the spread reacts if volatility falls as regional bank sentiment normalizes.
01 — Investment Thesis
The thesis: regional banks may still be priced too pessimistically.
The KRE research project was based on the view that U.S. regional banks were still being valued too pessimistically after the 2023 banking crisis. Investors remained concerned about deposit flight, commercial real estate exposure, credit losses, and interest rates staying higher for longer. These risks were real, but the thesis argued that the market may have already priced in a large amount of downside.
The core idea was that the market still appeared to be treating regional banks as if the 2023 crisis was fully ongoing, even though the sector had time to adjust. If interest rate conditions stabilized, deposits remained steady, liquidity improved, and investor sentiment recovered, KRE could potentially re-rate higher over a 12–18 month period.
Key Takeaway
KRE did not need a perfect economic environment to move higher. The thesis depended on stabilization, sentiment improvement, and a narrowing gap between market fear and actual fundamentals.
02 — Why KRE?
Broad regional bank exposure without relying on one single bank.
KRE, the SPDR S&P Regional Banking ETF, was used because it gives exposure to U.S. regional banks without making the thesis depend on one individual bank. That made KRE a cleaner vehicle for studying the broader regional banking recovery theme.
03 — Key Risks Behind the Thesis
The trade was bullish, but the risks were real.
Deposit Pressure
Renewed deposit outflows could weaken confidence in regional banks and pressure the ETF, restarting concerns from the 2023 banking crisis.
Commercial Real Estate
Regional bank exposure to CRE, especially office loans, remained a major risk factor that could pressure balance sheets.
Credit Losses
A weaker economy or recession could increase loan losses, reduce investor confidence, and push KRE back toward its lows.
Higher-for-Longer Rates
If interest rates stayed elevated longer than expected, bank funding costs and valuations could remain under pressure.
04 — Derivatives Structure
The structure: a defined-risk bull call vertical spread.
The research used a bull call vertical spread on KRE. The position involved buying the January 15, 2027 $65 call and selling the January 15, 2027 $80 call. The trade was entered for a net debit of $4.40 per spread, and two spreads were used, making the total cost $880. This structure matched the thesis because the view was bullish but not unlimited.
Key Takeaway
The bull call spread gave upside exposure if regional banks recovered, while keeping downside limited to the $880 debit paid. The maximum loss was defined before the trade was entered.
05 — Payoff Summary
The payoff was defined before the trade was entered.
The payoff was based on the $15 difference between the $65 long call and the $80 short call, minus the $4.40 debit paid. If KRE finished at or above $80 at expiration, the profit would be $10.60 per spread, or $2,120 total for two spreads. If KRE finished below $65, the maximum loss would be the $880 debit paid.
| Metric | Value |
|---|---|
| Strategy | Bull call vertical spread |
| Long call | KRE Jan. 15, 2027 $65 call |
| Short call | KRE Jan. 15, 2027 $80 call |
| Quantity | 2 spreads |
| Net debit | $4.40 per spread |
| Total maximum loss | $880 |
| Maximum profit | $2,120 |
| Breakeven | $69.40 |
| Best outcome | KRE at or above $80 by expiration |
| Worst outcome | KRE below $65 by expiration |
06 — ThinkorSwim Documentation
ThinkorSwim documentation
The following figures are ThinkorSwim screenshots documenting the trade structure, payoff profile, price sensitivity, and Greeks analysis.

Figure 1
KRE Jan. 15, 2027 $65/$80 Bull Call Vertical Spread
Caption: ThinkorSwim order entry showing the two option legs, quantity of 2, and $4.40 net debit.
Confirms the defined-risk structure of the trade. Shows that the position was built as a vertical spread rather than a standalone call or direct ETF position.

Figure 2
KRE Bull Call Spread Payoff at Expiration
Caption: ThinkorSwim risk profile showing defined downside, capped upside, and breakeven at $69.40.
Shows the central logic of the trade: limited downside, capped upside, and a clear breakeven level.

Figure 3
ThinkorSwim Price Slices and Greeks
Caption: Price slices showing that the spread gains as KRE rises, loses as KRE falls, with positive delta.
Supports the price sensitivity analysis. Shows that the trade is primarily directional and benefits when KRE moves higher.

Figure 4
Implied Volatility Sensitivity
Caption: IV scenario analysis showing slightly negative vega around the current price.
Shows that the trade is not mainly dependent on implied volatility expanding. Long and short call legs offset some volatility exposure.

Figure 5
Time Decay / Time Slice Analysis
Caption: Time-slice analysis showing that theta is reduced near current price because the short call offsets part of the long call's time decay.
Shows that time decay is reduced by the spread structure. Theta is not the largest immediate risk around the current price.
07 — Price Sensitivity
The trade was mainly driven by KRE’s price movement.
Around the reference price of $69.82, the trade was close to breakeven. If KRE rose to $78.67, the position showed an open profit of about $549.57. If KRE fell to $62.07, the position showed an open loss of about $435.80.
| Scenario | ThinkorSwim Result | What It Shows |
|---|---|---|
| KRE at $78.67 | +$549.57 | Trade gains if KRE rises toward upper strike |
| KRE at $69.82 | Close to breakeven | Position near entry — thesis in early stages |
| KRE at $62.07 | −$435.80 | Trade loses if KRE falls below breakeven |
Key Takeaway
The position was primarily a bullish directional trade. The most important driver was whether KRE moved higher toward the $80 short strike before expiration.
08 — Greeks Analysis
The Greeks explained the risk profile.
Delta
61.51
Positive delta confirmed the trade was bullish. The position benefited when KRE moved higher and lost value when KRE moved lower.
Gamma
0.80
Gamma showed delta would change as KRE moved. Most relevant near expiration and around the $65 or $80 strikes.
Theta
0.74
Slightly positive around current price because the short $80 call offset some of the long $65 call's time decay.
Vega
−4.10
Slightly negative. Long and short options offset some volatility exposure. IV expansion slightly hurt; IV decrease slightly helped.
09 — Implied Volatility Sensitivity
The spread was not mainly dependent on volatility expansion.
The IV analysis showed mixed volatility exposure. If implied volatility increased by 5%, the P/L fell to about $57.26. If implied volatility decreased by 5%, the P/L rose to about $79.03.
| IV Scenario | Result | Interpretation |
|---|---|---|
| IV +5% | +$57.26 | Higher IV slightly reduced value due to negative vega |
| IV −5% | +$79.03 | Lower IV slightly increased value |
Key Takeaway
Unlike a standalone long call, this spread was not mainly a volatility expansion trade. The main thesis was that KRE would move higher in price.
10 — Time Decay Analysis
Time decay was reduced by the spread structure.
The short $80 call offset some of the theta decay from the long $65 call. Around the reference price, theta was slightly positive at about 0.74. Time slices showed the position at about +$21.39 at T+30 and about +$68.20 at T+90 near the current level.
| Time Scenario | Result | Interpretation |
|---|---|---|
| T+30 days | +$21.39 | Position retained value near current price |
| T+90 days | +$68.20 | Spread still held meaningful value over time |
Key Takeaway
Time was not the biggest short-term risk. The January 2027 expiration gave the thesis time to develop without immediate theta pressure.
11 — Risk Management Plan
Defined risk still requires active management.
The main risk was that the KRE thesis was wrong or took too long to play out. If regional bank conditions weakened again, KRE might not move high enough for the spread to become profitable before expiration.
12 — What Could Move KRE From Here
Key drivers to watch
| Driver | Bullish Sign | Bearish Sign |
|---|---|---|
| Interest rates | Stabilization or cuts | Higher-for-longer rates |
| Deposits | Stable or growing | Renewed outflows |
| CRE exposure | Losses contained | Office loan stress worsens |
| Credit quality | Delinquencies stable | Credit losses rise |
| Bank earnings | Strong liquidity / deposit data | Weak guidance |
| Fed policy | Dovish guidance | Hawkish guidance |
| Market sentiment | Fear fades, sector re-rates | Crisis concerns return |
13 — Conclusion
The main lesson was structure.
The KRE bull call spread fit the thesis because it created bullish exposure while keeping risk controlled. If KRE recovered and moved closer to the $80 short strike before January 2027, the position could become more profitable. If the thesis was wrong, the maximum loss was limited to the $880 debit paid.
The ThinkorSwim analysis showed that the trade was mostly driven by KRE’s price movement. Delta and price slices confirmed that the position gained when KRE moved higher. Vega and theta still mattered, but were not the main drivers because the long and short call legs offset part of that exposure.
Key Takeaway
This case study shows how a market thesis can be translated into a defined-risk structure. Connecting market research, risk management, and disciplined investment communication is the goal of the Altovix platform.
Research and educational content only. This page reflects Altovix's internal investment research process and a personal capital allocation. It is not investment advice, a client recommendation, or an offer to manage outside capital. Past performance does not guarantee future results.